GeoMCU Sensor Platform
At UIUC’s UbiHealth Lab, I’m building a vibration-sensing prototype with an ESP32-C6 and a VPU sensor. I built the sensing firmware, a Python receiver for timestamped CSV capture, and a Streamlit dashboard that handles live and recorded data.
- ESP32-C6
- FreeRTOS
- TCP
- Python / Streamlit
Sampling without waiting on Wi-Fi
I sample processed vibration-response values at 100 Hz, with an ESP32 timestamp for each reading. When sampling and networking shared a loop, TCP sends sometimes blocked for seconds. I split them into separate FreeRTOS tasks and put a 2,000-sample RAM queue between them—about 20 seconds of buffering. The acquisition task can keep running while the network task waits.
I compared UDP and TCP, verified complete 50-sample TCP batches with no missing batches in the tested sessions, and stopped the Mac receiver to test recovery. Readings queued during the outage and drained after reconnection. Longer outages filled the queue and produced dropped-sample counts, establishing the buffer’s recovery limit.
- VPU activity
- 100 Hz acquisition
- FreeRTOS queue
- TCP → Python / CSV
- Processed response sampling
- 100 Hz
- Samples buffered in RAM
- 2,000
- Sample spacing observed in bench tests
- 9.9–10.1 ms
Finding the hardware fault
Before the sensor responded reliably, I checked GPIO loopback, power and ground, the generated clock, and the data path. That narrowed the problem to unsoldered header connections and a faulty VPU. Soldering the headers and replacing the sensor restored repeatable responses to physical taps.
I then added adaptive idle-noise calibration, impact separation, and logarithmic response scaling so weak and strong taps remain distinguishable. These readings track processed digital activity; they are not a decoded physical waveform.
From the bench to the dashboard
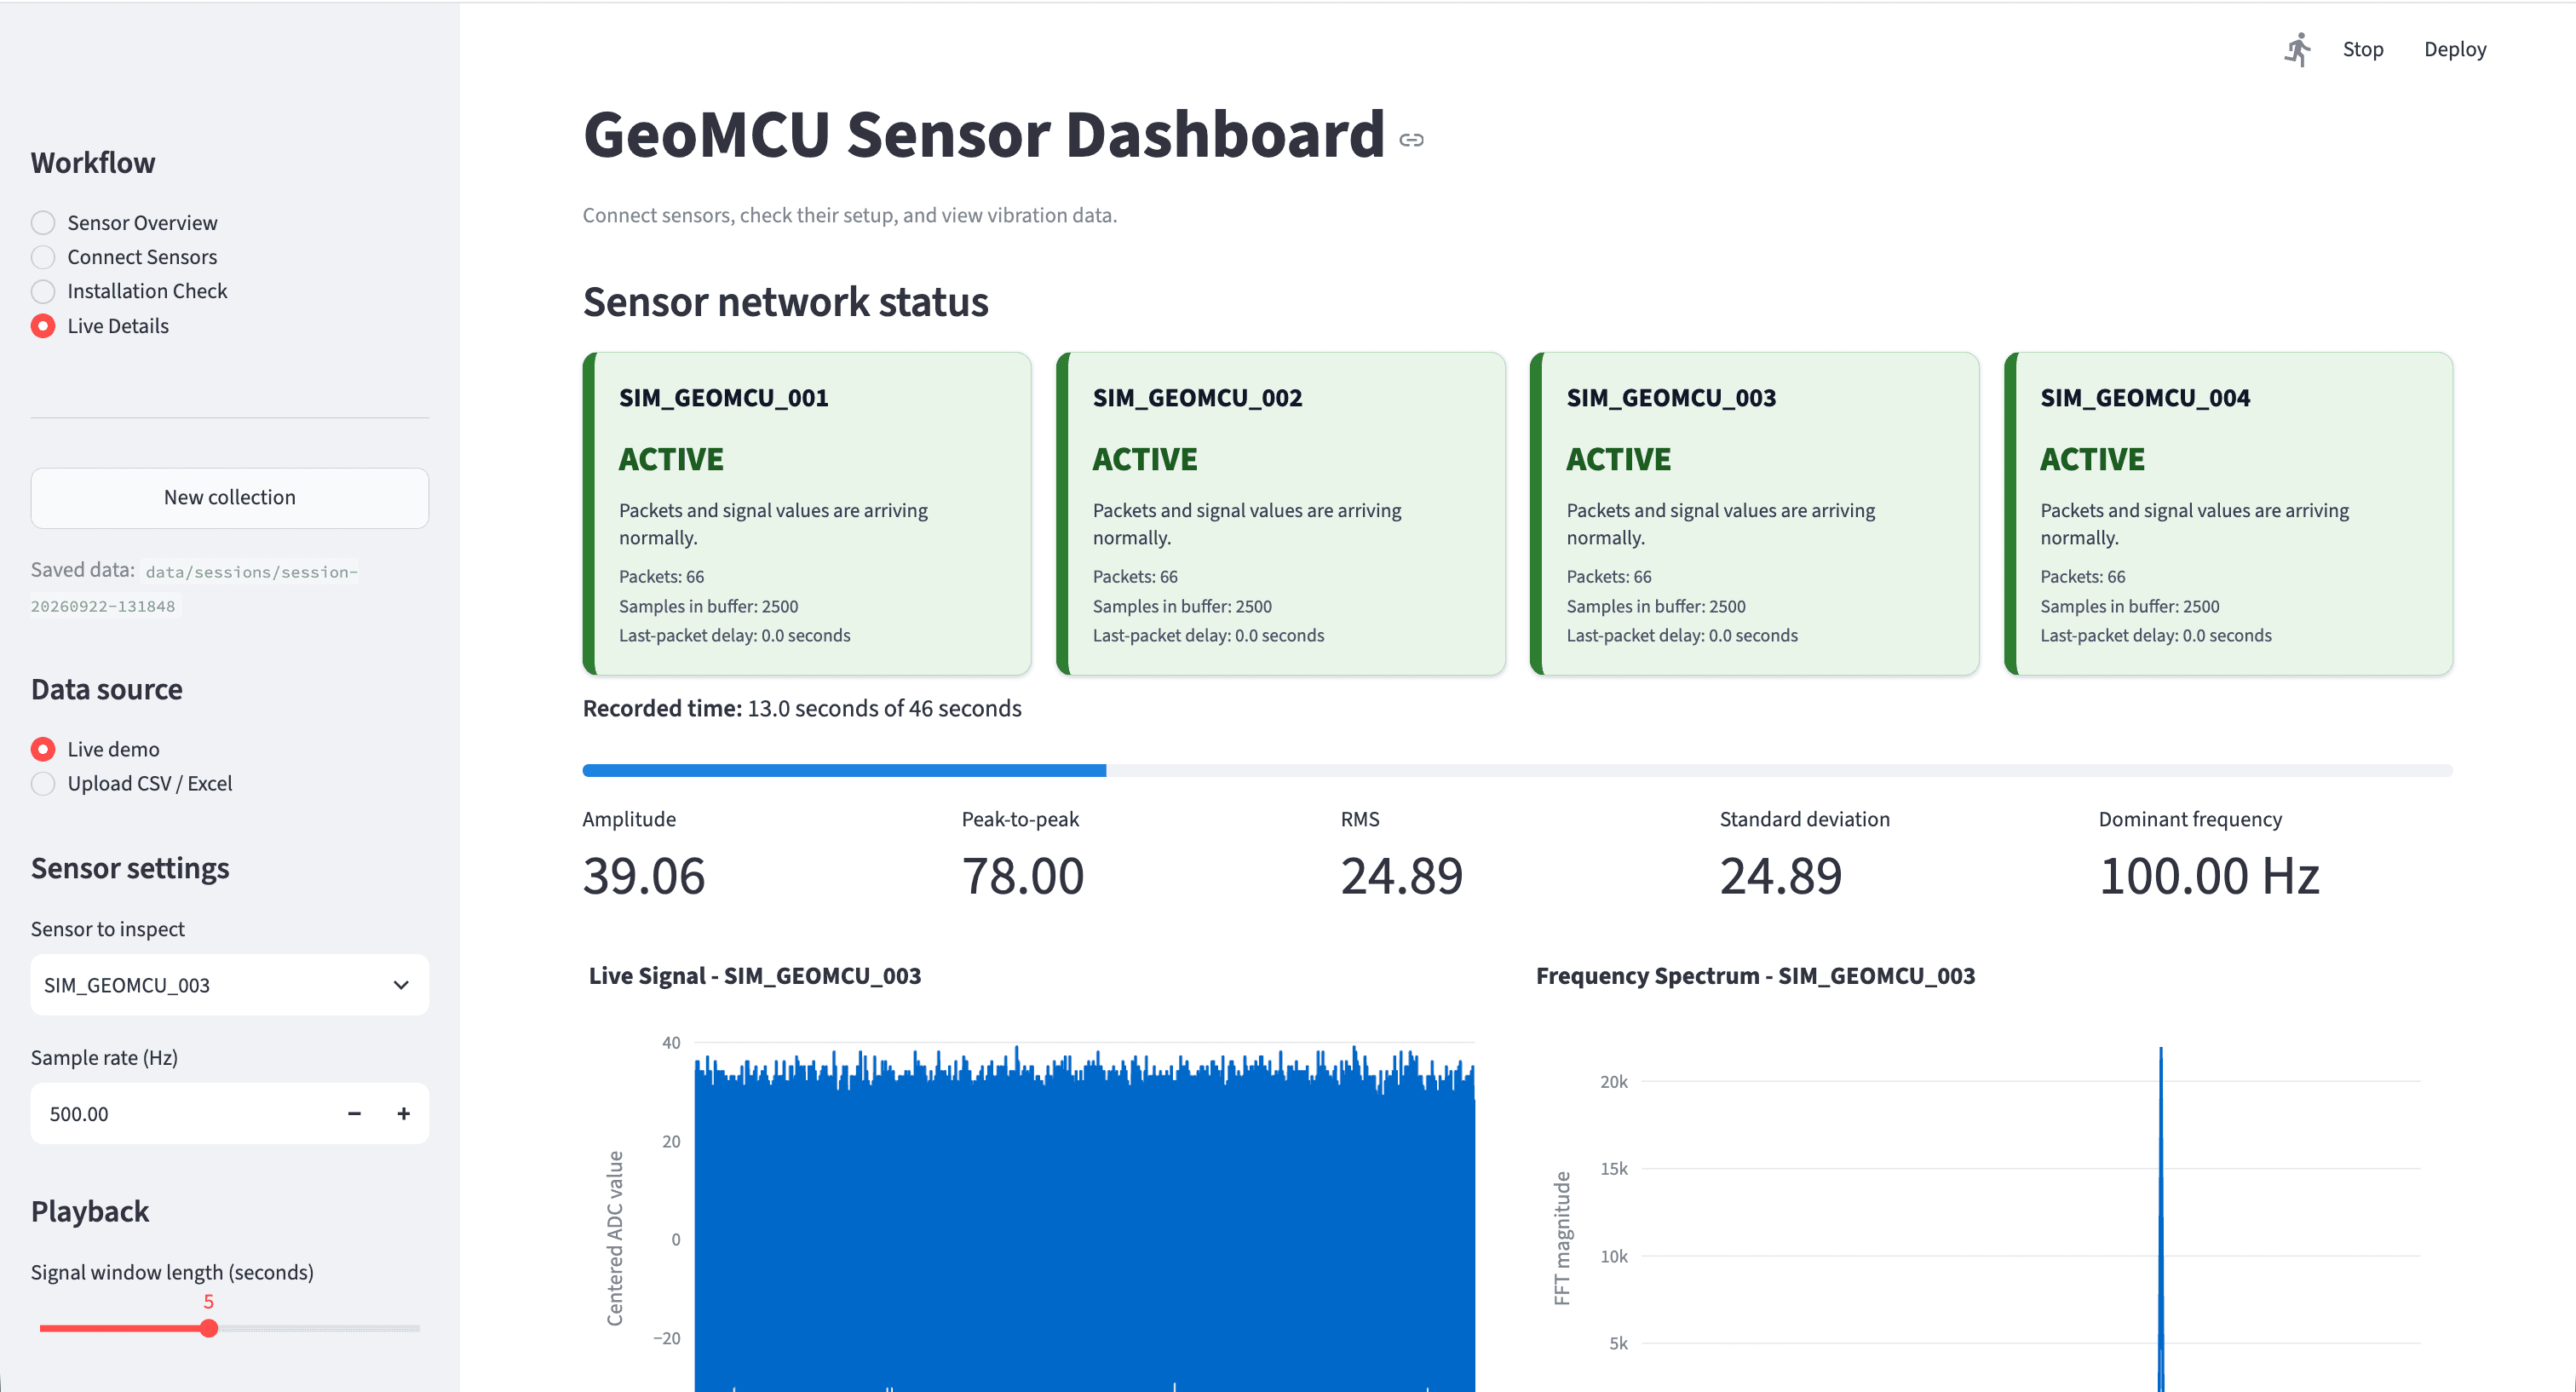
The real stream now produces CSV recordings and live graphs that respond to taps. The dashboard uses a shared analysis layer for TCP recordings, MQTT inputs, and replay. I also tested offline detection with roughly 1,100 packets from four simulated sensors—the screenshot above shows that demo, not a four-device deployment.
What I’m working on next
Full PDM waveform decoding, multi-node synchronization, Raspberry Pi-based sensor ingestion, and field deployment remain in progress. The current results come from controlled prototype tests.